Property Hazard Risk Data
Identify Risk for Water, Air, Earth and Fire Hazard for Any Property in the U.S.
Knowing if homes are in a flood, tsunami, fire, or earthquake zone can provide a detailed plan for customers your business can reach. If you’re part of the insurance industry or need to make internal risk assessments based on natural hazards, this kind of data is imperative to keep new business coming in and ensure every customer gets the exact type of coverage that’s best for their needs. Plus, it’s a great way to communicate with customers about the dangers around their property.
Use Property Hazard Risk Data To:
- See detailed reports of natural hazard risks in any area
- Reach out to potential customers who could use targeted insurance services
- Pinpoint exact hazards at the address level for granular risk assessment
- Give the most personalized insurance quotes by knowing which services your customers need
- Determine which customers can best use services for mitigation, new roofs, storm preparedness
Wind Risk
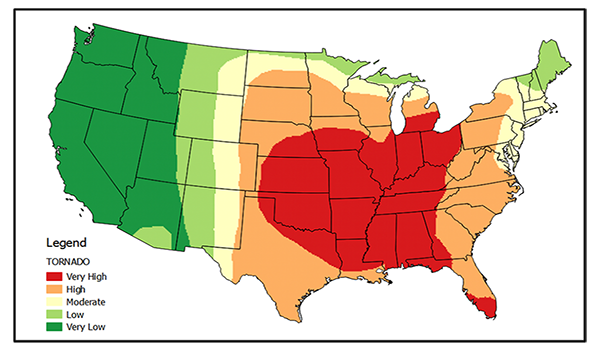
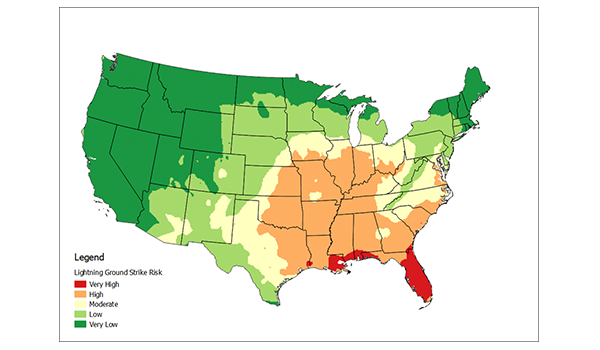
Wind damage caused $180 billion in total losses between 2006-2015. In addition, lighting, hail, straight-line winds, and tornadoes produced 1,646 deaths during that same decade. Knowing the expected frequency of these events can help predict major problem areas for use in modeling risk analysis and providing accurate insurance quotes to customers who live and work in these locations.
The Damaging Wind Risk File has been compiled from long-term NOAA Doppler radar, with over 30 years of convective storm event data for 31 million records.

Ground Risk
Besides earthquakes, which account for an average of $12 billion per year in damages, there are many other ground risks that need to be accounted for, such as sinkholes, brownfields, and superfund sites.
Sinkholes are depressions or holes in the earth that are caused by the collapse of the surface layer. They can vary in size and complexity, may form gradually or suddenly, and are most frequently located in landscape formed by the dissolution of soluble rocks, including limestone and dolomite, called a karst region. In the U.S., Florida is a major sinkhole danger zone.
Read More
+A brownfield is a property that may be complicated by the presence of hazardous substances, pollutants, or contaminants, such as asbestos, dioxin, lead, and radiation. HazardHub data shows more than 450,000 brownfields in the U.S. alone. If areas become federally designated superfund sites, that generally means these are much larger and more contaminated areas.
For earthquakes, the Hazard Risk Data service includes four geospatial files for estimating risk: peak ground acceleration for probability estimates, Western State faults to measure distance from active fault lines from the Rockies westward, fault and liquefaction zones for the eastern U.S., and fracking induced earthquake zones where drilling for oil and gas has caused more quakes to occur.
Wildfire Risk
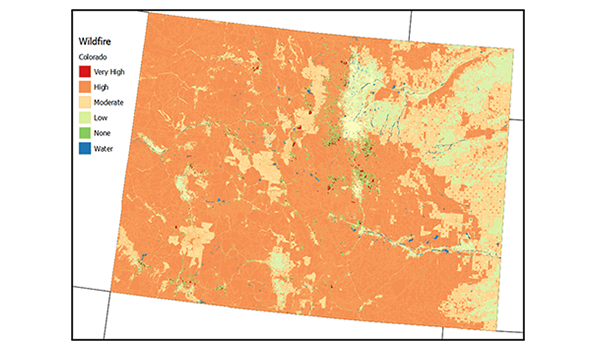
Wildfire, drought, and proximity to fire stations are all important factors in reviewing potential property damages, insurance costs, and assessing risk. From January to October of 2016, there were over 46,000 wildfires in the U.S., accounting for nearly $5 million in damages, and scientists predict these numbers will only rise as global warming increases.
With Wildfire Risk model, the data takes into account the amount of wildland vegetation, the distance to it from urban centers, and housing density rates to provide a scale and score of the risk associated with each location. There is also a Fire Protection Class model that considers how close or far fire protection services are from specific locations. Because extreme drought can also play a major role, there is also a drought layer that can be linked to each risk layer to show the increased risk in areas such as those in the southeast and western U.S.

Water Risk
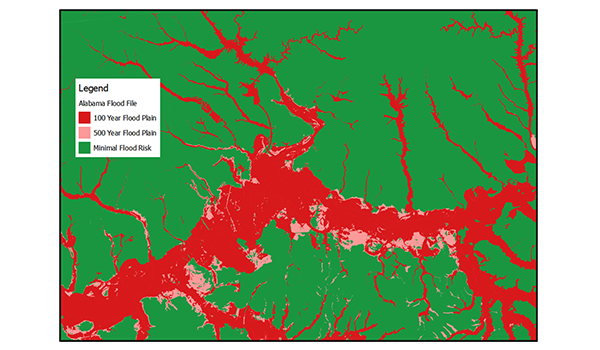
Hurricanes and floods are all-too-common in many parts of the U.S. and account for some of the most expensive destruction, not just from the acts themselves but from damaging winds, coastal storm surges, and additional flooding after the fact. And though storm surges and hurricanes are limited to coastal areas, their effects can occur many miles inland.
The Water Risk Files consist of over 100 years of hurricane, flood, and storm surge events. The Hurricane Risk File contains four major analog risk levels: Very High for the potential of 1 event per 10 years, High for 1 event every 20 years, Moderate for 1 per 30 years, and Low for 1 event every 40 years. The flood Risk File measures FEMA data and the risk of flooding for any given point using the distance to major waterways and the elevation of the point above these areas.
Read More
+There is also a tsunami Risk File for the west coast of the U.S., where earthquakes and fault zones can trigger seismic waves near California, Oregon, and Washington.
For earthquakes, the Hazard Risk Data service includes four geospatial files for estimating risk: peak ground acceleration for probability estimates, Western State faults to measure distance from active fault lines from the Rockies westward, fault and liquefaction zones for the eastern U.S., and fracking induced earthquake zones where drilling for oil and gas has caused more quakes to occur.

Request a Demonstration
A demonstration with one of our representatives gives you a first-hand look at our products in action. Request one today.
Request Demo NowHelpful Resources
Data Enhancement/Full Spectrum video
Watch VideoReady to Start Your Demo?
Start today with Melissa's wide range of Data Quality Solutions, Tools, and Support.
Schedule a Demo
